Raster data
Introduction
The terra package has functions for creating, reading, manipulating,
and writing raster data. The package provides, among other things,
general raster data manipulation functions that can easily be used to
develop more specific functions. For example, there are functions to
read a chunk of raster values from a file or to convert cell numbers to
coordinates and back. The package also implements raster algebra and
many other functions for raster data manipulation.
SpatRaster
A SpatRaster represents multi-layer (multi-variable) raster data. A
SpatRaster always stores a number of fundamental parameters decribing
its geometry. These include the number of columns and rows, the spatial
extent, and the Coordinate Reference System. In addition, a
SpatRaster can store information about the file in which the raster
cell values are stored. Or, if there is no such a file, a SpatRaster
can hold the cell values in memory.
Here I create a SpatRaster from scratch. But note that in most cases
where real data is analyzed, these objects are created from a file.
library(terra)
## terra 1.9.21
r <- rast(ncol=10, nrow=10, xmin=-150, xmax=-80, ymin=20, ymax=60)
r
## class       : SpatRaster
## size        : 10, 10, 1  (nrow, ncol, nlyr)
## resolution  : 7, 4  (x, y)
## extent      : -150, -80, 20, 60  (xmin, xmax, ymin, ymax)
## coord. ref. : lon/lat WGS 84 (CRS84) (OGC:CRS84)
SpatRaster r only has the geometry of a raster data set. That is, it
knows about its location, resolution, etc., but there are no values
associated with it. Let’s assign some values. In this case I assign a
vector of random numbers with a length that is equal to the number of
raster cells.
values(r) <- runif(ncell(r))
r
## class       : SpatRaster
## size        : 10, 10, 1  (nrow, ncol, nlyr)
## resolution  : 7, 4  (x, y)
## extent      : -150, -80, 20, 60  (xmin, xmax, ymin, ymax)
## coord. ref. : lon/lat WGS 84 (CRS84) (OGC:CRS84)
## source(s)   : memory
## name        :    lyr.1
## min value   :  0.01247
## max value   : 0.960454
You could also assign cell numbers (in this case overwriting the previous values)
values(r) <- 1:ncell(r)
r
## class       : SpatRaster
## size        : 10, 10, 1  (nrow, ncol, nlyr)
## resolution  : 7, 4  (x, y)
## extent      : -150, -80, 20, 60  (xmin, xmax, ymin, ymax)
## coord. ref. : lon/lat WGS 84 (CRS84) (OGC:CRS84)
## source(s)   : memory
## name        : lyr.1
## min value   :     1
## max value   :   100
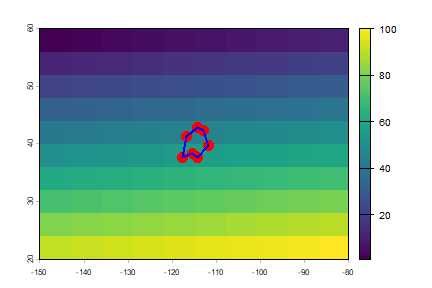
We can plot this object.
plot(r)
# add polygon and points
lon <- c(-116.8, -114.2, -112.9, -111.9, -114.2, -115.4, -117.7)
lat <- c(41.3, 42.9, 42.4, 39.8, 37.6, 38.3, 37.6)
lonlat <- cbind(id=1, part=1, lon, lat)
pts <- vect(lonlat)
pols <- vect(lonlat, type="polygons", crs="+proj=longlat +datum=WGS84")
points(pts, col="red", pch=20, cex=3)
lines(pols, col="blue", lwd=2)
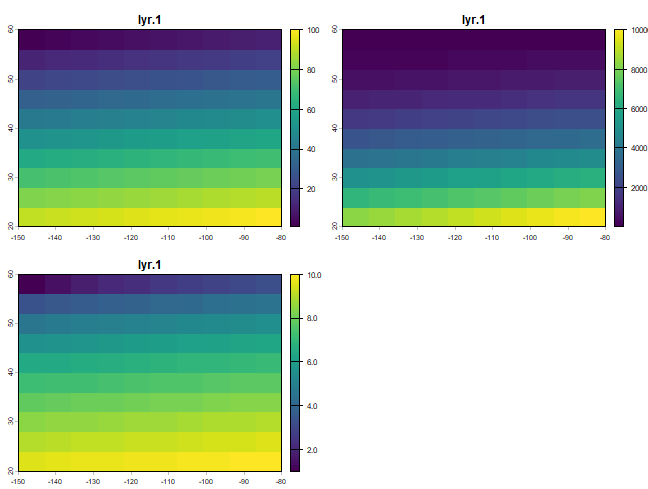
You can create a multi-layer object using the c method.
r2 <- r * r
r3  <- sqrt(r)
s <- c(r, r2, r3)
s
## class       : SpatRaster
## size        : 10, 10, 3  (nrow, ncol, nlyr)
## resolution  : 7, 4  (x, y)
## extent      : -150, -80, 20, 60  (xmin, xmax, ymin, ymax)
## coord. ref. : lon/lat WGS 84 (CRS84) (OGC:CRS84)
## source(s)   : memory
## names       : lyr.1, lyr.1, lyr.1
## min values  :     1,     1,     1
## max values  :   100, 10000,    10
plot(s)