Maps
Like for other plots, there are different approaches in R to make maps.
You can use “base plot” in many cases. Alternatively use levelplot,
either via the spplot function (implemented in sp and
raster) or via the rasterVis package.
Here are some brief examples about making maps. You can also look elsewhere on the Internet, like here, or this for spplot and rasterVis.
Vector data
Base plots
library(raster)
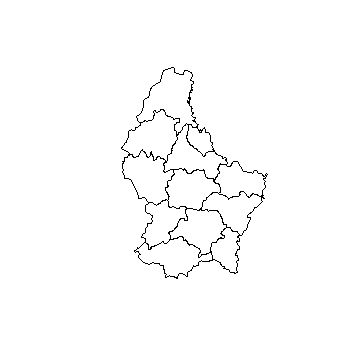
p <- shapefile(system.file("external/lux.shp", package="raster"))
plot(p)
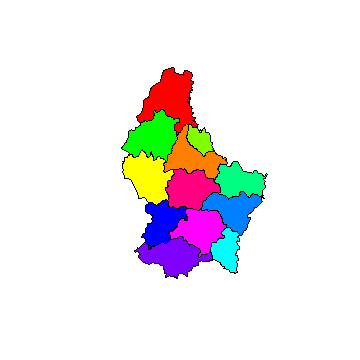
n <- length(p)
plot(p, col=rainbow(n))
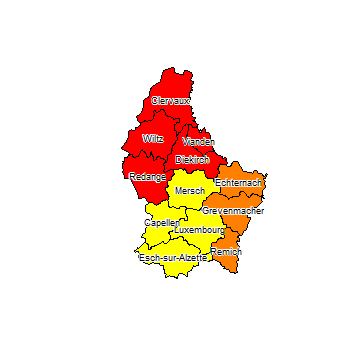
One colour per region (NAME_1)
u <- unique(p$NAME_1)
u
## [1] "Diekirch"     "Grevenmacher" "Luxembourg"
m <- match(p$NAME_1, u)
plot(p, col=rainbow(n)[m])
text(p, 'NAME_2', cex=.75, halo=TRUE)
Raster
Example data
library(raster)
b <- brick(system.file("external/rlogo.grd", package="raster"))
r <- raster(p, res=0.01 )
values(r) <- 1:ncell(r)
r <- mask(r, p)
Several generic functions have been implemented for Raster* objects to
create maps and other plot types. Use ‘plot’ to create a map of a
Raster* object. When plot is used with a RasterLayer, it calls the
function ‘rasterImage’ (but, by default, adds a legend; using code from
fields::image.plot). It is also possible to directly call image.
You can zoom in using ‘zoom’ and clicking on the map twice (to indicate
where to zoom to). With click it is possible to interactively query
a Raster* object by clicking once or several times on a map plot.
After plotting a RasterLayer you can add vector type spatial data
(points, lines, polygons). You can do this with functions points, lines,
polygons if you are using the basic R data structures or plot(object,
add=TRUE) if you are using Spatial* objects as defined in the sp
package. When plot is used with a multi-layer Raster* object, all
layers are plotted (up to 16), unless the layers desired are indicated
with an additional argument.
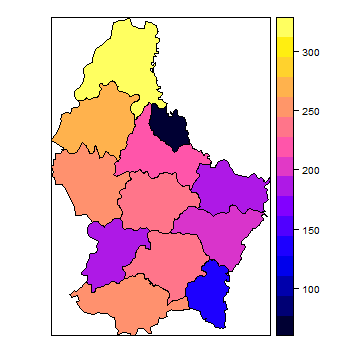
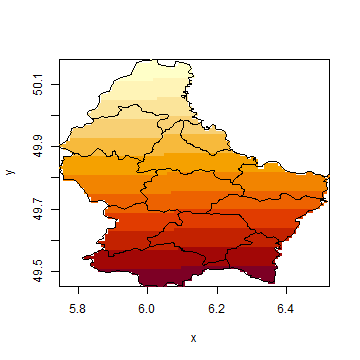
plot(r)
plot(p, add=TRUE)
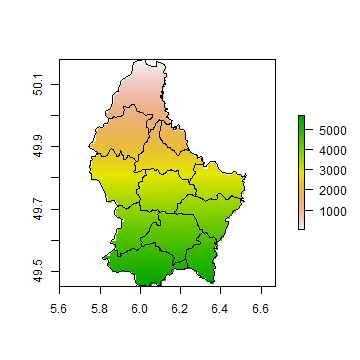
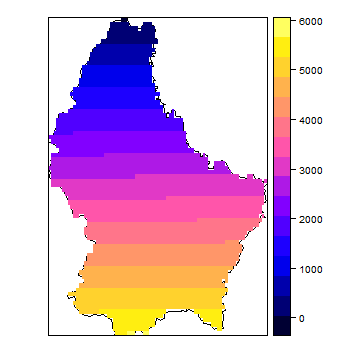
image does not provide a legend and that can be advantageous in some
cases.
image(r)
plot(p, add=TRUE)
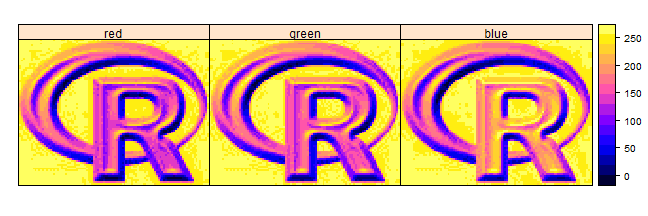
Multi-layer Raster objects can be plotted as individual layers
plot(b)
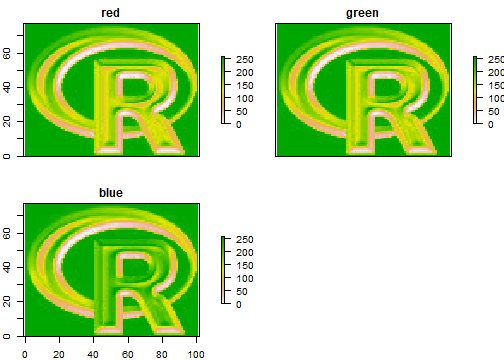
They can also be combined into a single image, by assigning individual layers to one of the three color channels (red, green and blue):
plotRGB(b, r=1, g=2, b=3)

You can also plot Raster* objects with spplot.
bounds <- list("sp.polygons", p)
spplot(r, sp.layout=bounds)
spplot(b, layout=c(3,1))
The rasterVis package has several other lattice based plotting
functions for Raster* objects. The
rasterVis package also
facilitates creating a map from a RasterLayer with the ggplot2
package.
You can also use a number of other plotting functions with raster
objects, including hist, persp, contour}, and density.
See the help files for more info.
Specialized packages
coming soon….